Perth
Federal electorate · Western Australia
Named after the City of Perth. Under instructions from the Secretary for the Colonies, Sir George Murray, the new town and future seat of government in the Colony of Western Australia was called Perth. Murray was a Perthshire man and represented his birthpace in the House of Commons.
Covers: The Division of Perth consists of: City of Vincent, part of the City of Bayswater, part of the City of Perth, and part of the City of Stirling.
| Enrolled voters | 114,458 |
|---|---|
| Area | 69 sq km |
| Demographic rating | Inner Metropolitan – situated in capital cities and consisting of well-established built-up suburbs. |
| Established | 5 Dec 1900 |
| Name first used | 1901 federal election |
| Boundary gazetted | 24 September 2024 |
Current member
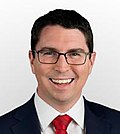
2025 federal election: two-candidate preferred
| Candidate | Party | Votes | % | Swing |
|---|---|---|---|---|
| Patrick Gorman ✓ | Australian Labor Party | 66,350 | 66.51 | +2.09 |
| Susanna Panaia | Liberal | 33,406 | 33.49 | -2.09 |
2025 federal election: first preferences
| Candidate | Party | Votes | % | Swing |
|---|---|---|---|---|
| Patrick Gorman ✓ | Australian Labor Party | 42,947 | 43.05 | +3.91 |
| Susanna Panaia | Liberal | 26,026 | 26.09 | -1.12 |
| Sophie Greer | The Greens (WA) Inc | 24,467 | 24.53 | +2.52 |
| Peter Hallifax | Pauline Hanson's One Nation | 6,316 | 6.33 | +3.71 |
| Informal ballots | 2,491 | 2.44 | -3.07 | |
Candidate percentages are of formal votes; the informal share is of all ballots cast.
Results at each election
| Election | Elected | Party | Two-candidate % |
|---|---|---|---|
| 2025 federal election | Patrick Gorman | Australian Labor Party | 66.51 |
| 2022 federal election | Patrick Gorman | Australian Labor Party | 64.80 |
| 2019 federal election | Patrick Gorman | Australian Labor Party | 54.93 |
| 2018 Perth by-election | Patrick Gorman | Australian Labor Party | 62.92 |
| 2016 federal election | Tim Hammond | Australian Labor Party | 53.33 |
| 2013 federal election | Alannah Mactiernan | Australian Labor Party | 54.35 |
| 2010 federal election | Stephen Francis Smith | Australian Labor Party | 55.88 |
| 2007 federal election | Stephen Smith | Australian Labor Party | 58.85 |
| 2004 federal election | Stephen Smith | Australian Labor Party | 56.73 |
Every contest for a division of this name since 2004, each on the boundaries in force at the time. The two-candidate figure is the winner's share of the final count.
Election figures and profile © Commonwealth of Australia (AEC), CC BY 4.0. Date established from the Parliamentary Handbook. ✓ marks the elected candidate.