Fisher
Federal electorate · Queensland
Named in honour of Andrew Fisher, 1862–1928, Prime Minister of Australia (1908–09, 1910–13, 1914–15) and a Member of the House of Representatives (1901–15).
Covers: The Division of Fisher consists of part of the Sunshine Coast Regional Council.
| Enrolled voters | 139,064 |
|---|---|
| Area | 1,198 sq km |
| Demographic rating | Rural – outside capital cities and without majority of enrolment in major provincial cities |
| Established | 11 May 1949 |
| Name first used | 1949 federal election |
| Boundary gazetted | 27 March 2018 |
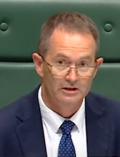
Current member
2025 federal election: two-candidate preferred
| Candidate | Party | Votes | % | Swing |
|---|---|---|---|---|
| Andrew Wallace ✓ | LNP | 66,385 | 56.03 | -2.64 |
| Morrison Lakey | Australian Labor Party | 52,087 | 43.97 | +2.64 |
2025 federal election: first preferences
| Candidate | Party | Votes | % | Swing |
|---|---|---|---|---|
| Andrew Wallace ✓ | LNP | 44,100 | 37.22 | -7.03 |
| Morrison Lakey | Australian Labor Party | 26,380 | 22.27 | -1.06 |
| Keryn Jones | Independent | 19,296 | 16.29 | +16.29 |
| Renay Wells | The Greens | 11,396 | 9.62 | -4.19 |
| Benjamin Kelly | Pauline Hanson's One Nation | 7,199 | 6.08 | -3.23 |
| James Pidgeon | Gerard Rennick People First | 4,972 | 4.20 | +4.20 |
| Denis Fricot | Trumpet of Patriots | 3,050 | 2.57 | +2.57 |
| Bronwen Bolitho | Family First | 2,079 | 1.75 | +1.75 |
| Informal ballots | 6,798 | 5.43 | +2.28 | |
Candidate percentages are of formal votes; the informal share is of all ballots cast.
Results at each election
| Election | Elected | Party | Two-candidate % |
|---|---|---|---|
| 2025 federal election | Andrew Wallace | LNP | 56.03 |
| 2022 federal election | Andrew Wallace | Liberal National Party of Queensland | 58.67 |
| 2019 federal election | Andrew Wallace | Liberal National Party of Queensland | 62.70 |
| 2016 federal election | Andrew Wallace | Liberal National Party of Queensland | 59.06 |
| 2013 federal election | Mal Brough | Liberal National Party of Queensland | 59.75 |
| 2010 federal election | Peter Slipper | Liberal National Party of Queensland | 54.13 |
| 2007 federal election | Peter Slipper | Liberal | 53.10 |
| 2004 federal election | Peter Slipper | Liberal | 62.98 |
Every contest for a division of this name since 2004, each on the boundaries in force at the time. The two-candidate figure is the winner's share of the final count.
Election figures and profile © Commonwealth of Australia (AEC), CC BY 4.0. Date established from the Parliamentary Handbook. ✓ marks the elected candidate.